Google Charts
All Charts in Site
https://developers.google.com/chart/interactive/docs/gallery/scatterchart?hl=ru
Example
<script type="text/javascript" src="https://www.gstatic.com/charts/loader.js"></script> <div id="chart_div"></div>
<script>
google.charts.load('current', {packages: ['corechart', 'bar']});
google.charts.setOnLoadCallback(drawTitleSubtitle);
function drawTitleSubtitle() {
var data = google.visualization.arrayToDataTable([
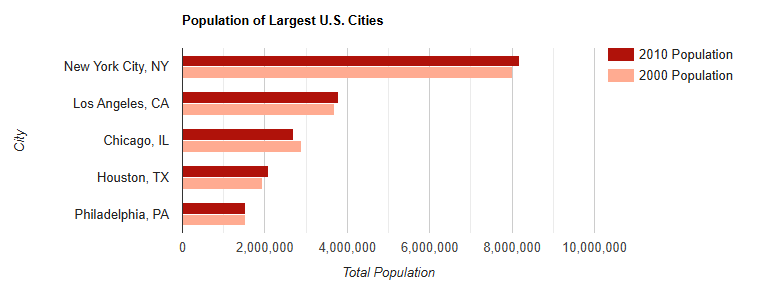
['City', '2010 Population', '2000 Population'],
['New York City, NY', 8175000, 8008000],
['Los Angeles, CA', 3792000, 3694000],
['Chicago, IL', 2695000, 2896000],
['Houston, TX', 2099000, 1953000],
['Philadelphia, PA', 1526000, 1517000]
]);
var materialOptions = {
chart: {
title: 'Population of Largest U.S. Cities',
subtitle: 'Based on most recent and previous census data'
},
hAxis: {
title: 'Total Population',
minValue: 0,
},
vAxis: {
title: 'City'
},
bars: 'horizontal'
};
var materialChart = new google.charts.Bar(document.getElementById('chart_div'));
materialChart.draw(data, materialOptions);
}
</script>